drag a node · scroll to zoom · hover for details — a real public graph

Every commit you've made, as one living graph.

commit-grapher pulls your history from GitHub, Azure DevOps and more into a single interactive network graph, a contribution heatmap, and a stats dashboard. Your code is never cloned.

Your code lives on GitHub, your work items in Jira or Azure Boards? commit-grapher pulls every version-control host and your issue trackers together — all your scattered activity under one framework.

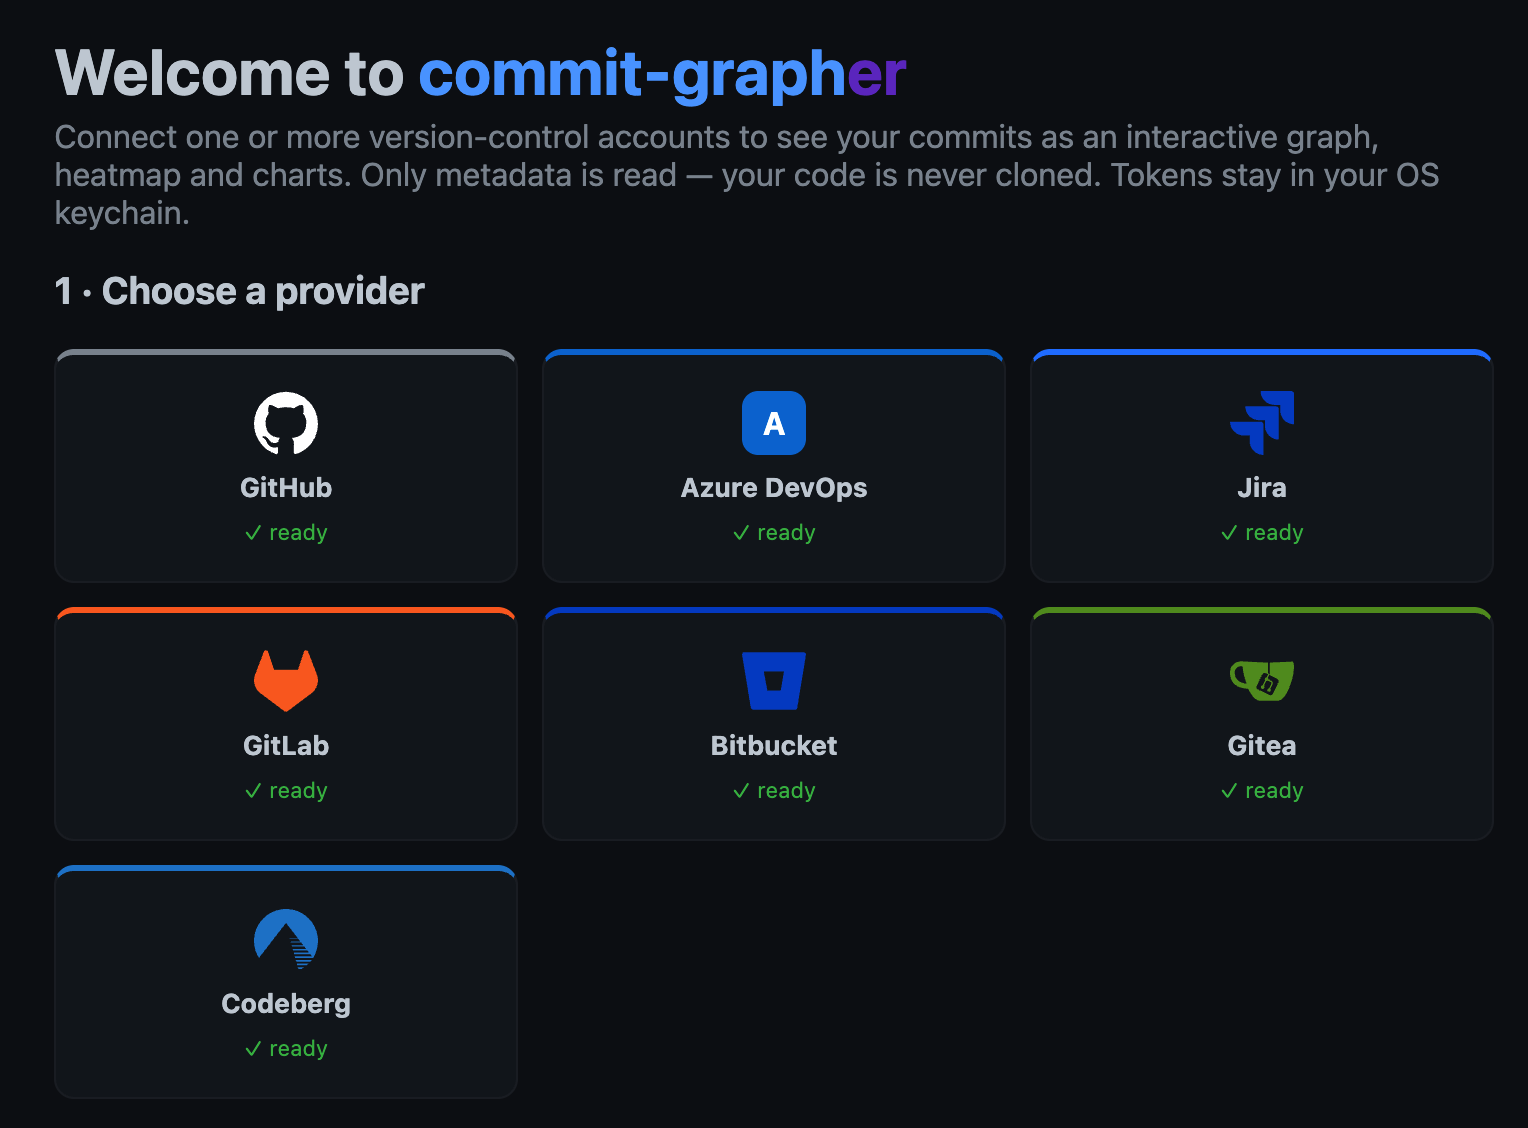
GitHub Azure DevOps Jira · work items GitLab Bitbucket Gitea Codeberg
One place for everything

Five ways to see your work

Connect an account and the first thing you see is the graph. Then drill anywhere.

🕸️

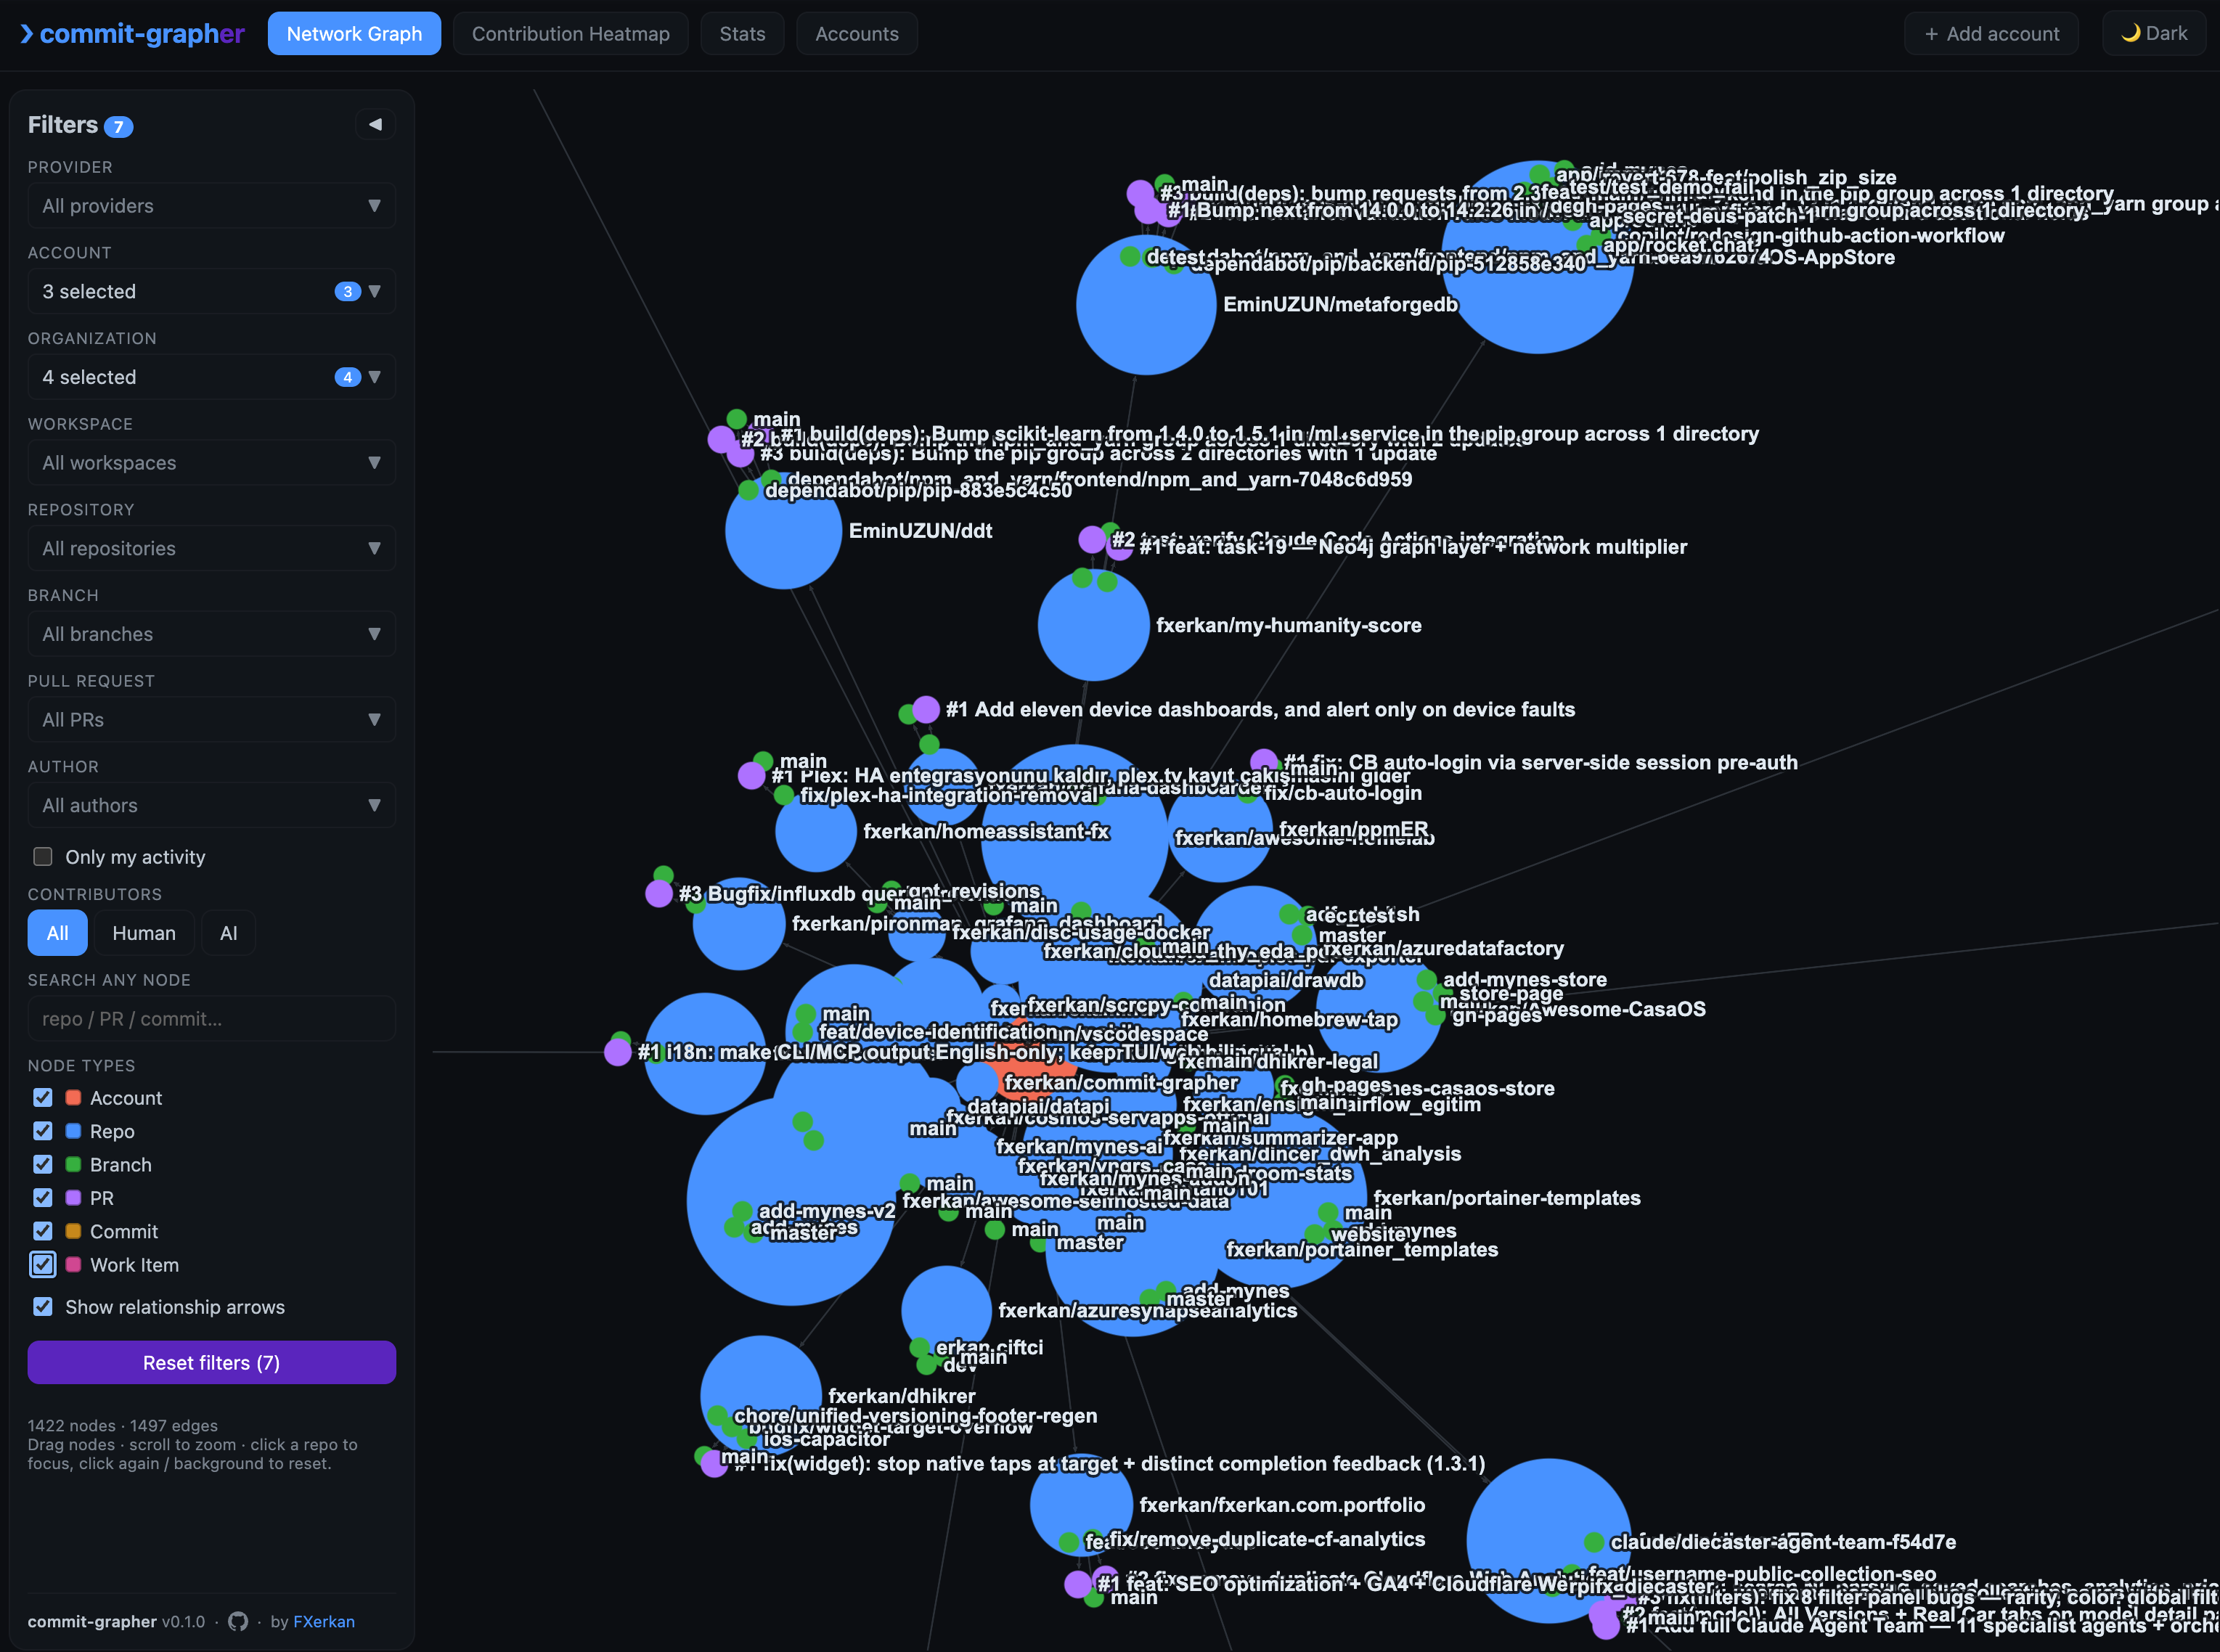
Network graph

Accounts → repos → branches → PRs → commits as an Obsidian-style WebGL graph. Physics, zoom, drag, focus, and deep filtering across every dimension.

🟩

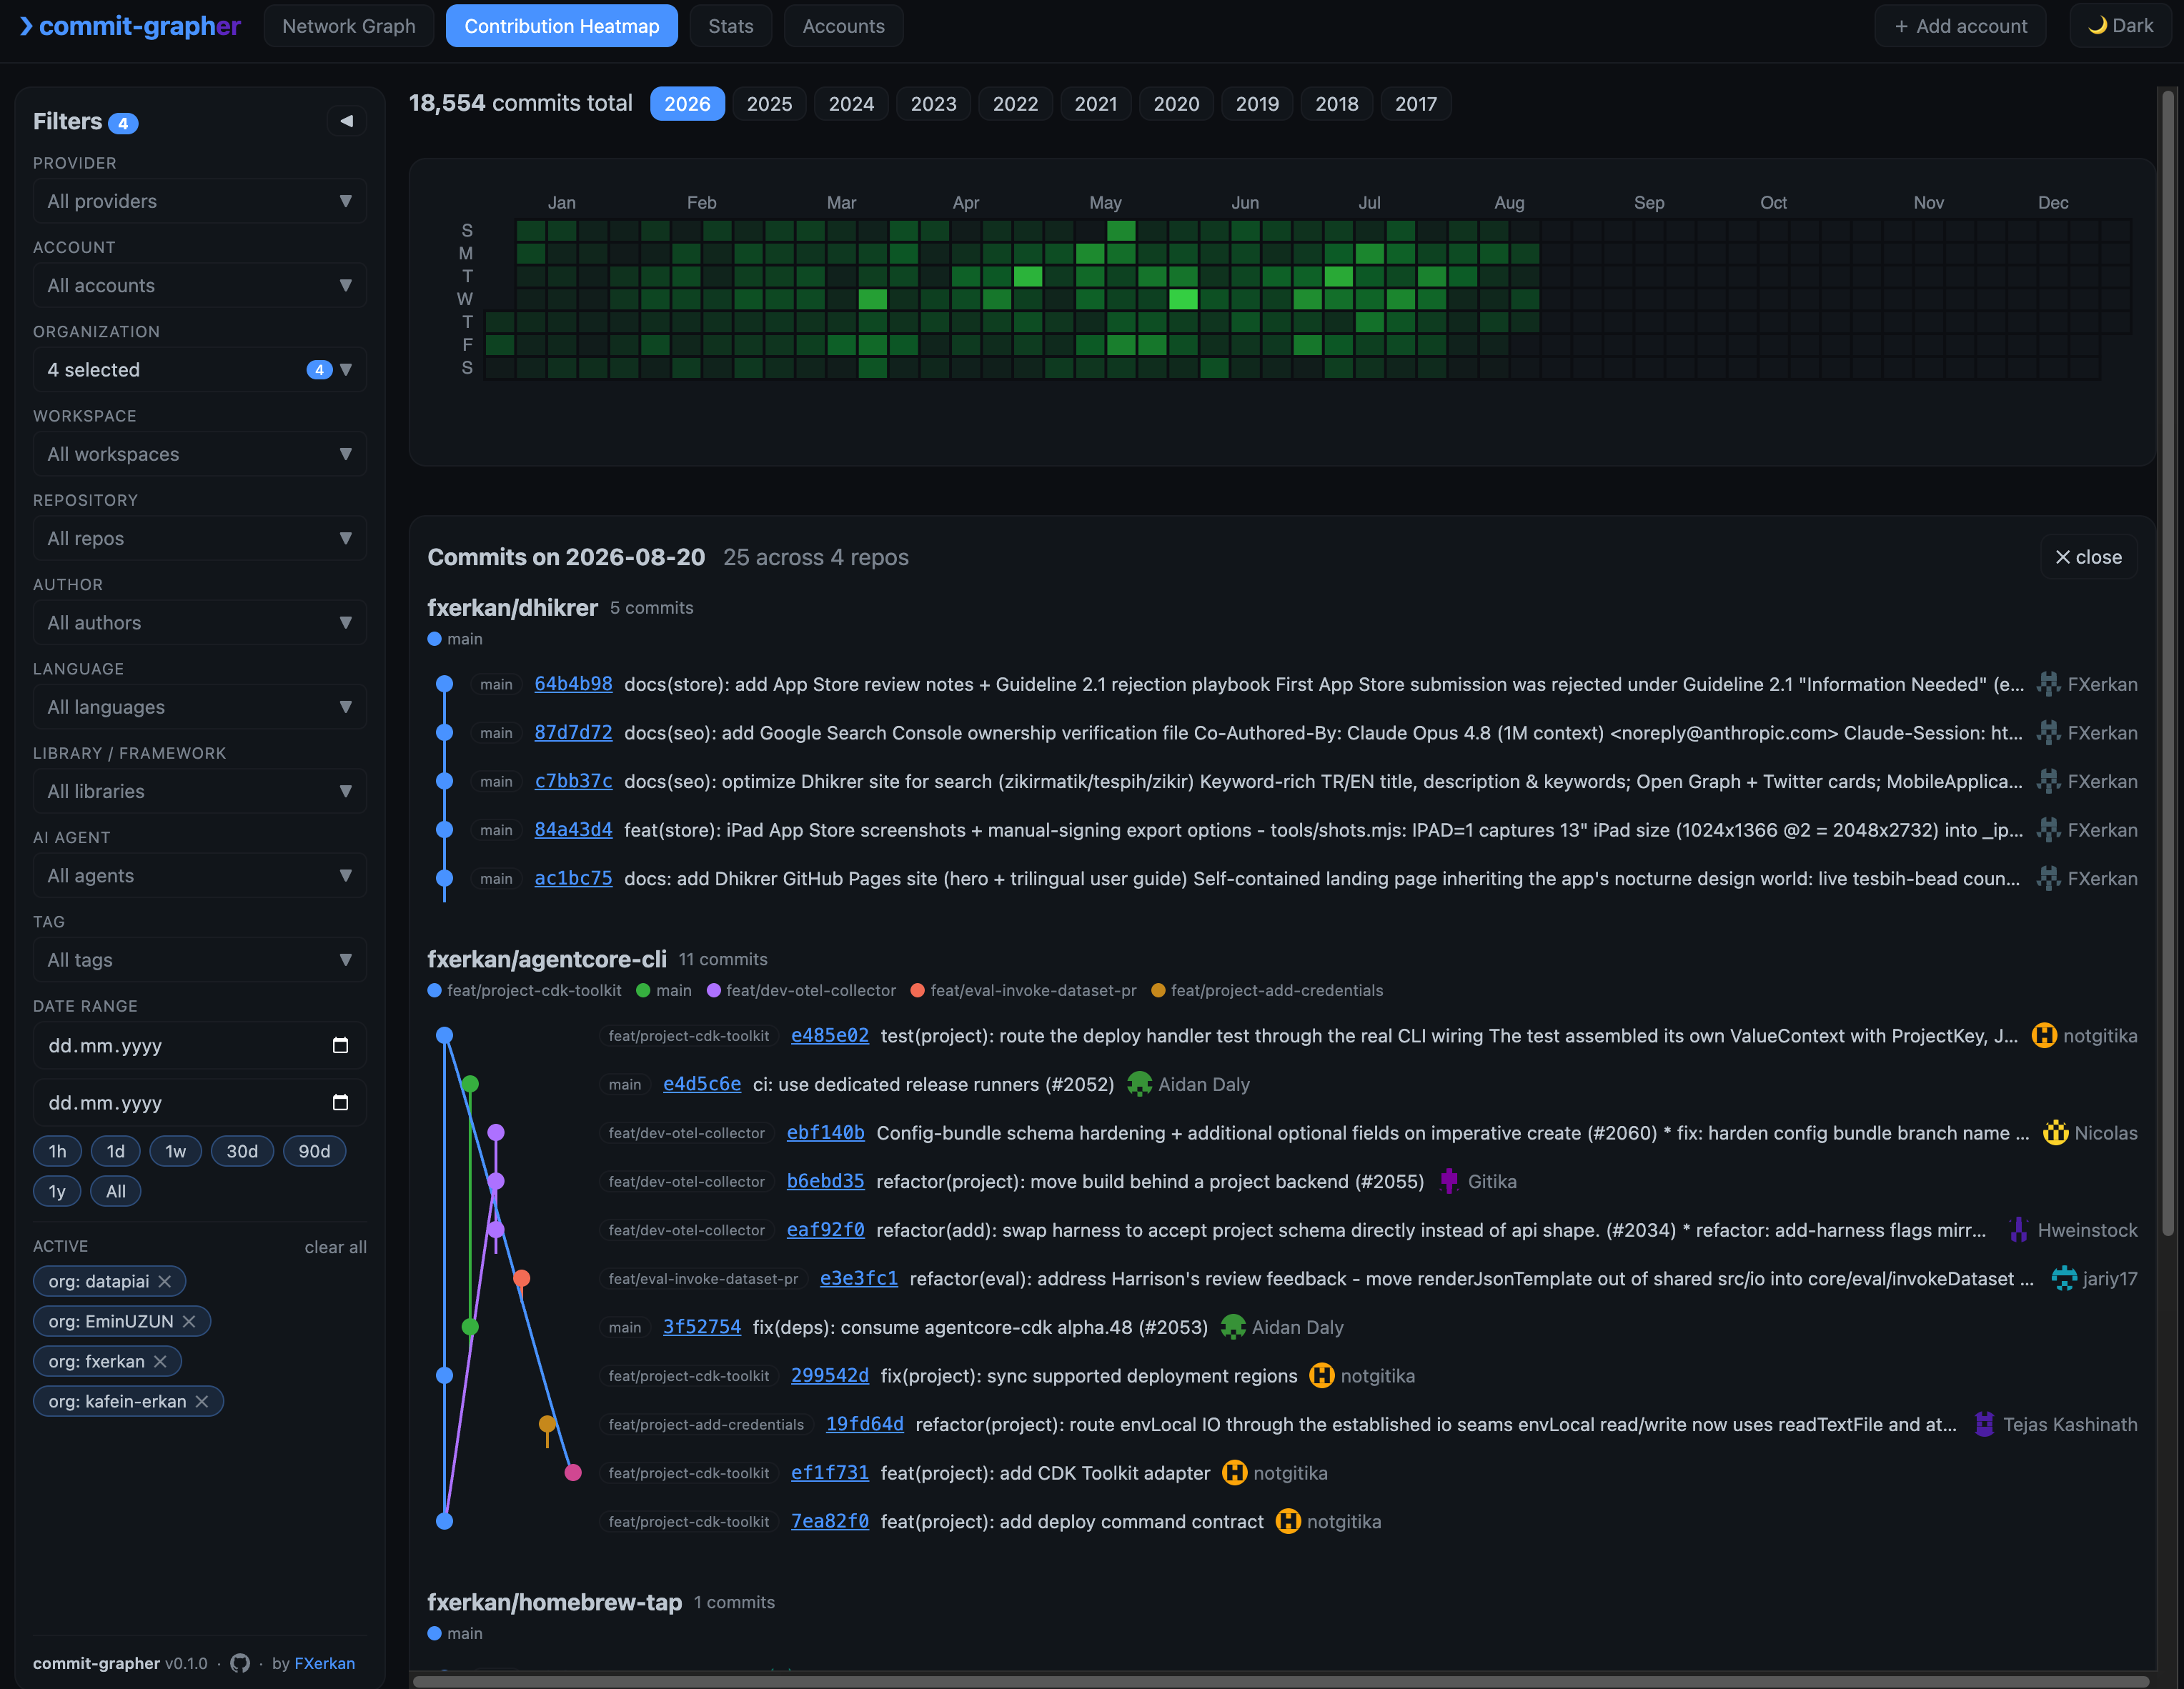
Contribution heatmap

A GitHub-style calendar combined across every provider. Click any day to drill into a real git-graph — branch & merge lanes, clickable commits.

📊

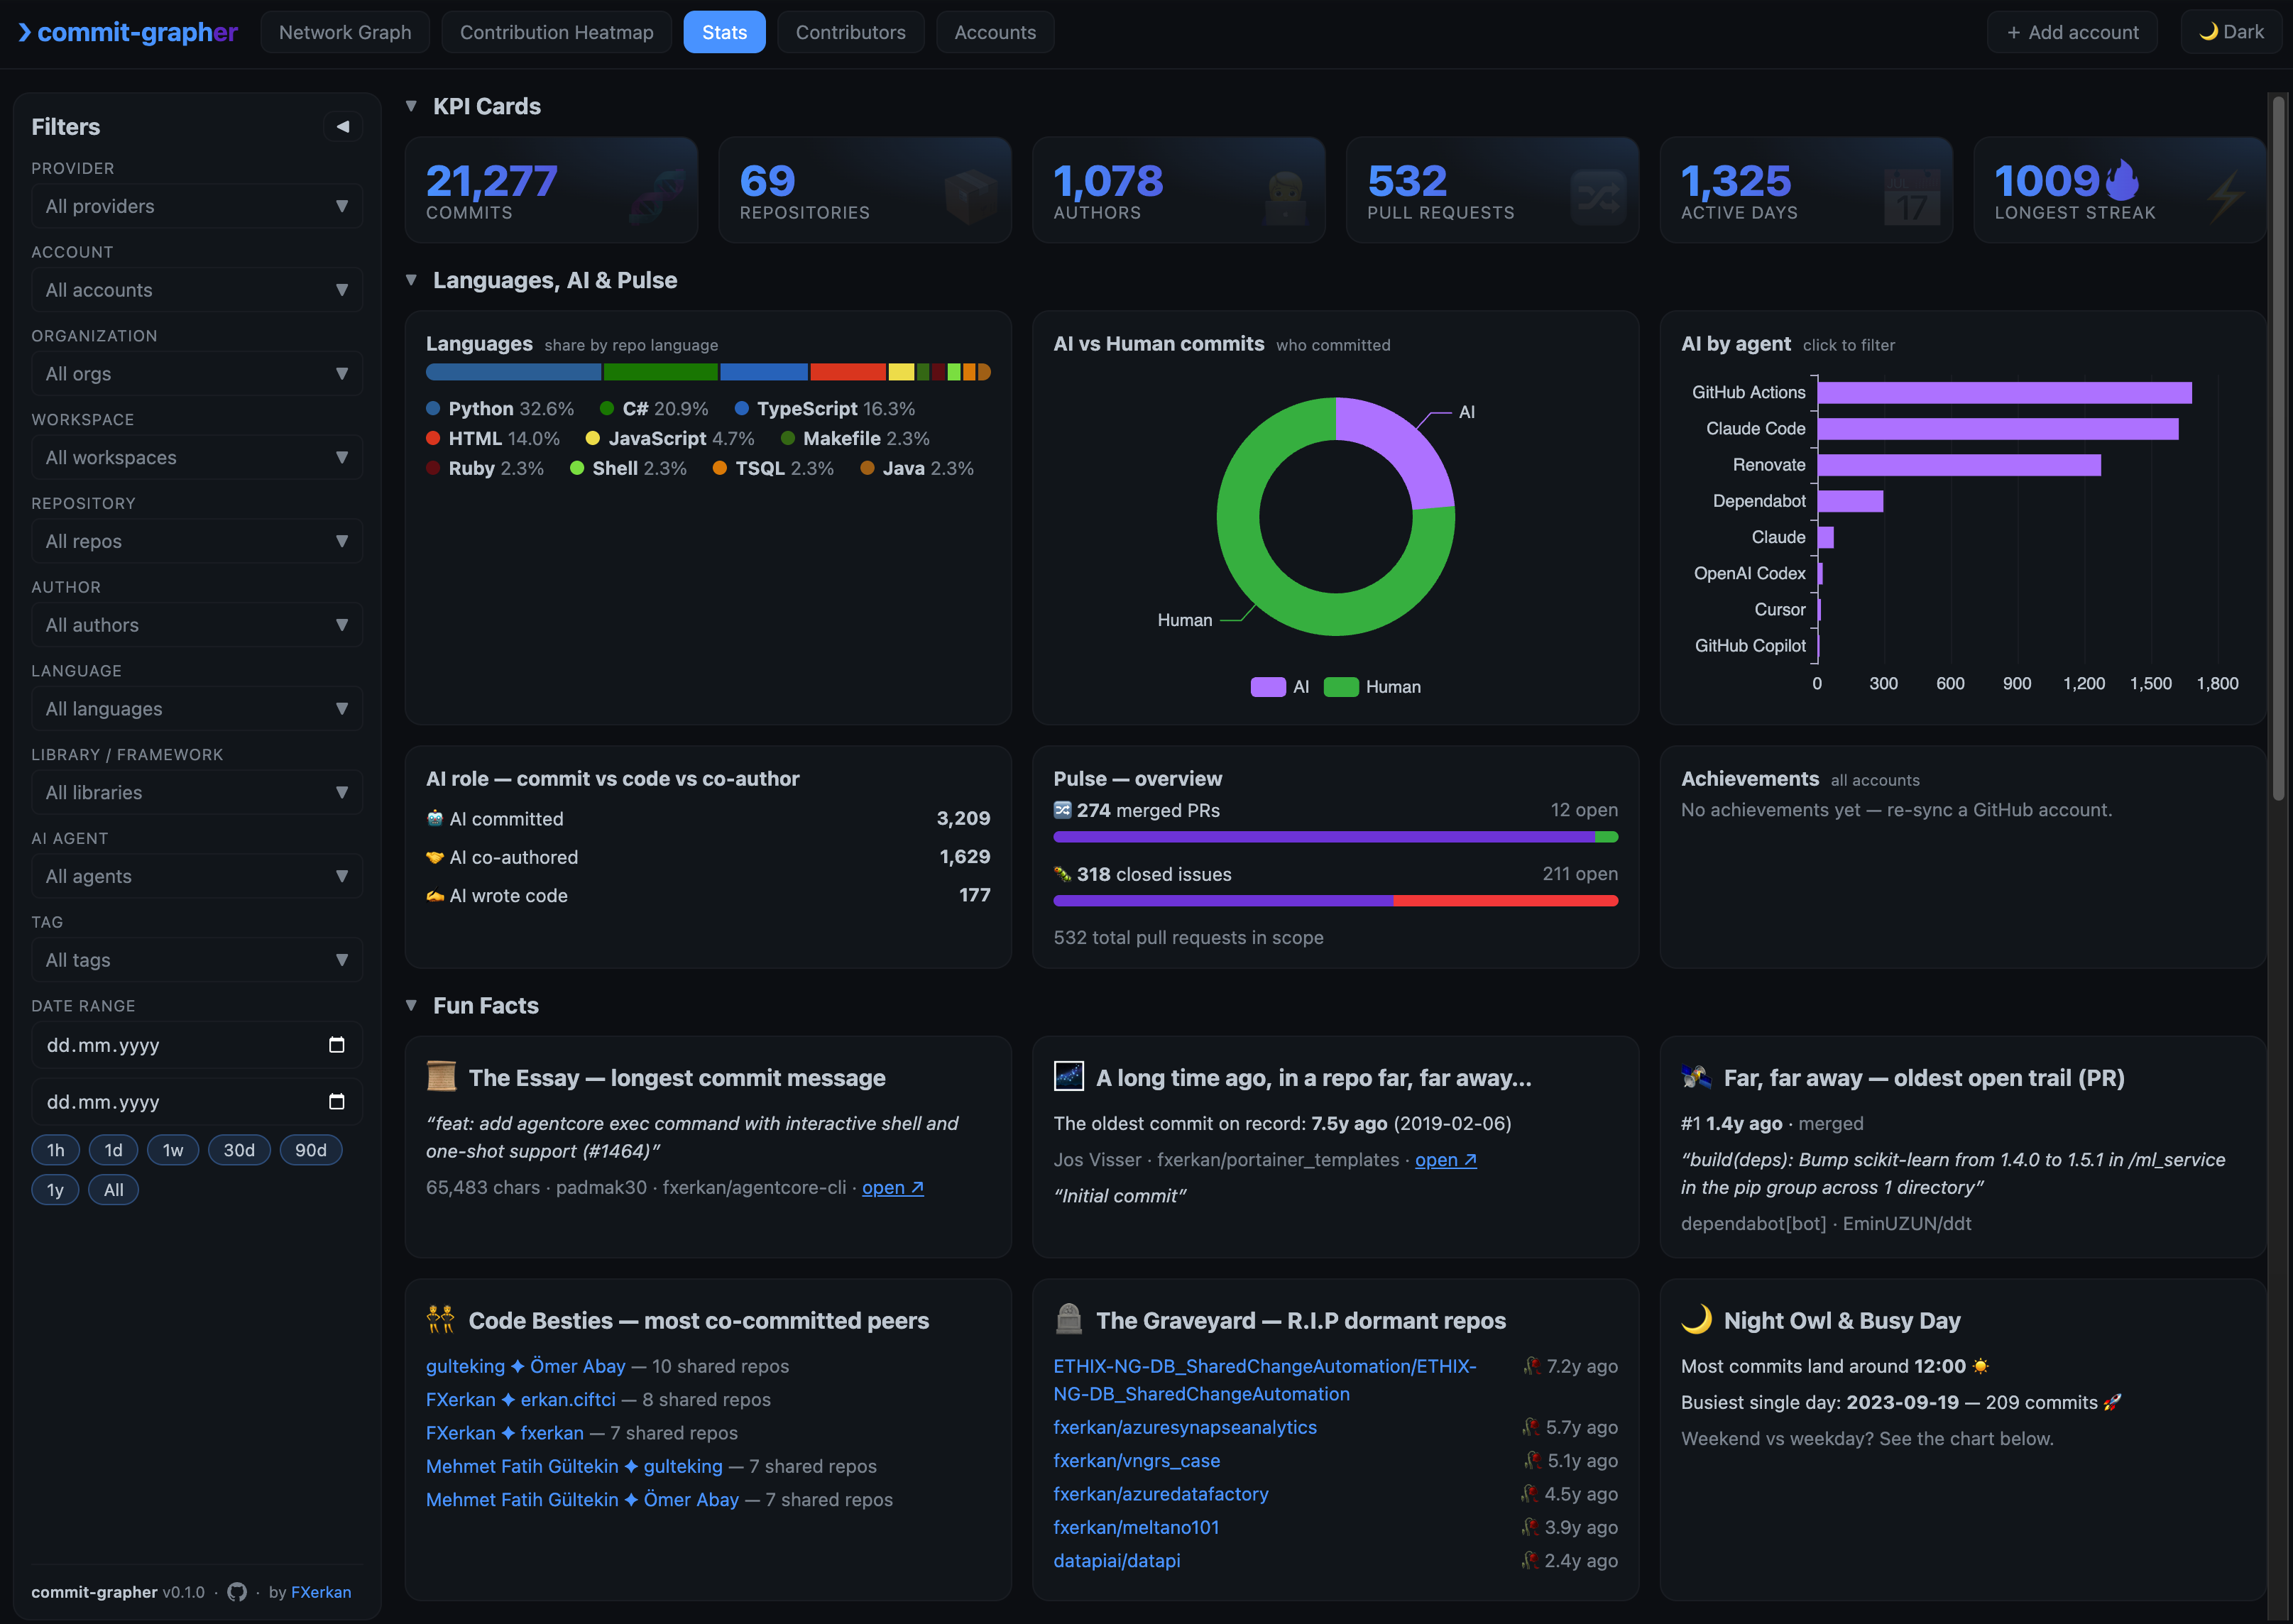
Stats dashboard

KPIs, night-owl hours, code besties, the repo graveyard, stars/forks/releases — with cross-filtering, so one click reshapes every view.

👥

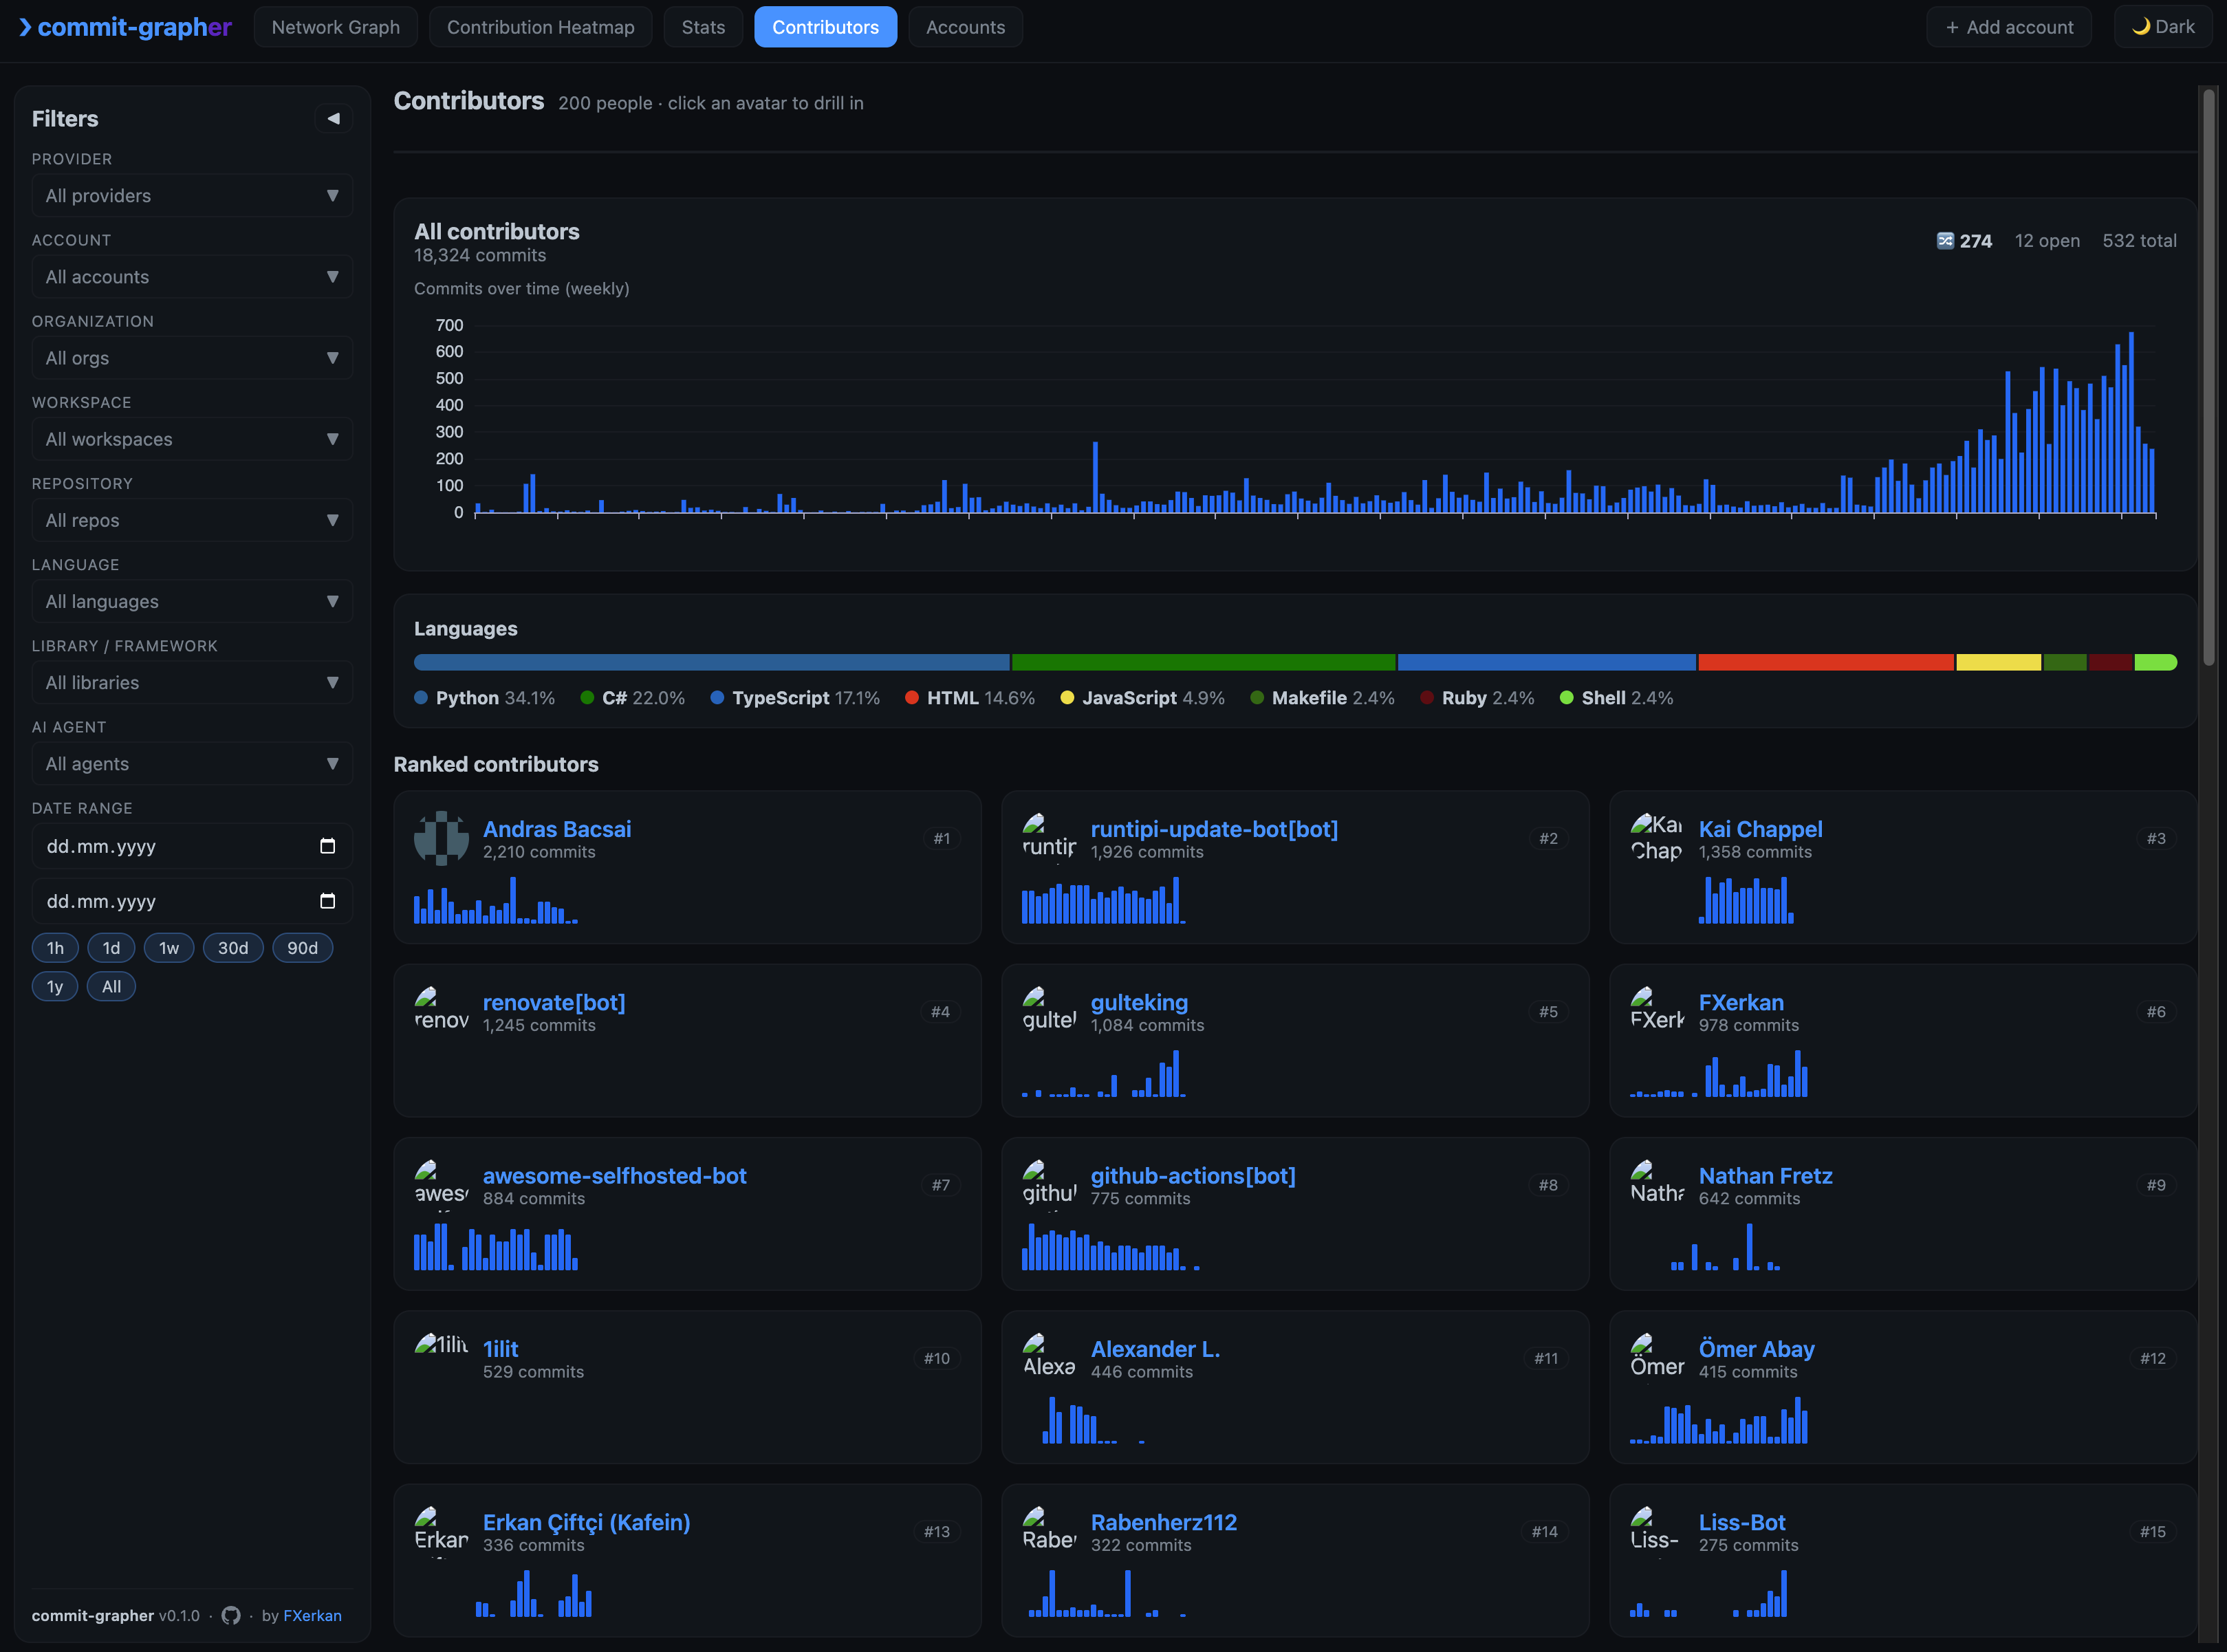
Contributors

Everyone who's touched your repos, ranked — with a human-vs-AI breakdown, so you can see how much your agents actually wrote.

🔌

Multi-provider

GitHub, Azure DevOps, GitLab, Bitbucket, Gitea and Codeberg on one adapter — plus Jira issues matched to your commits. Public usernames or private repos with a token.

💻

Local-first

Runs on your machine on a local port. No account, no cloud, no telemetry. Tokens live in your OS keychain, never on disk.

A tour of every page

What each screen does

Real screenshots from the app — dark theme, your data.

🕸️ Network Graph

A physics-driven map of your entire git footprint.

  • Drag nodes, scroll to zoom, hover to light up a neighbourhood.
  • Click a repo to focus/drill in; background to reset.
  • Filter by provider, account, org, workspace, repo, branch, PR, author, tag.
  • Human vs AI toggle and Only my activity to cut the noise.
Network Graph, dark theme

🟩 Contribution Heatmap

  • The familiar year calendar — merged across all providers at once.
  • Pick a year; click a day to expand its commits as a git-graph.
Contribution heatmap

📊 Stats dashboard

  • KPI cards, plus fun deep-dives: The Essay, far, far away, Code Besties, The Graveyard, your night-owl hour.
  • Repository stats: stars, forks, releases, contributors, Docker pulls, npm downloads.
  • Click any chart to cross-filter; collapse any section.
Stats dashboard

👥 Contributors

  • Every contributor across your repos, ranked by commits.
  • Human-vs-AI split — see how much your agents actually wrote.
Contributors page

🔌 Accounts & integrations

  • Add a provider with a Personal Access Token or GitHub OAuth device flow.
  • Rename accounts, then Sync. Export/import your dataset as JSON.
Accounts and integrations
🔒

Your code never leaves your machine

commit-grapher reads only metadata — commit messages, branch names, PR titles, timestamps — through each provider's REST API. It never clones a repository or reads a single line of source. Tokens live in your OS keychain.

GitHub Azure DevOps Jira · issues GitLab Bitbucket Gitea Codeberg
Run it locally

Up in two minutes

Python ≥ 3.13 backend, Vite/React frontend. Nothing to deploy.

# backend
python -m venv .venv && source .venv/bin/activate
pip install -e backend
uvicorn app.main:app --app-dir backend --reload    # http://localhost:8000

# frontend (dev, hot reload)
cd frontend && npm install && npm run dev           # http://localhost:5173
# ...or build once and let the backend serve it:
cd frontend && npm run build
Docs

Connect your accounts

Two-minute guides with the exact token scopes — and the gotchas most people hit.

screenshot preview